

 TRADING THE SUN
A Modern Approach to Solar, Lunar & Natural Market Cycles
By SITHESH FINANCIAL ASTROLOGER
Cosmic Trading Strategies
—
Introduction — Is the Market Connected to Natural Cycles?
Financial markets are usually explained through numbers.
Interest rates. Inflation. Corporate earnings. Economic growth. Liquidity. Government policy. Supply and demand.
But beneath every chart is something more complicated:
Human behaviour.
Every market transaction represents a decision made by a person or an institution. Every trend reflects changing expectations. Every period of excessive optimism or fear reflects changing collective psychology.
This leads to an intriguing question:
«Could natural cycles influence human behaviour, and could those behavioural changes be reflected in financial markets?»
This is the central question behind Trading the Sun.
The research discussed in John Hampson’s Trading The Sun examines historical relationships involving solar activity, sunspots, geomagnetic conditions and lunar phases, and compares them with financial markets and broader economic cycles.
For a modern financial-astrology researcher, the subject presents an opportunity to explore markets from a different dimension:
Time.
Not simply:
«What is the price?»
But:
«Where are we within the cycle?»
—
1. Markets Are More Than Numbers
A stock-market chart is a record of prices.
But price is the final result of thousands or millions of decisions.
Investors react to:
– Expectations
– Fear
– Confidence
– Economic news
– Interest rates
– Earnings
– Liquidity
– Risk perception
– Social behaviour
This creates a powerful connection between economics and psychology.
A market can move rapidly when investors collectively become more optimistic. Similarly, fear can cause investors to reduce risk even when the underlying economic data has not changed dramatically.
Therefore, market analysis can be viewed through several dimensions:
Price → Fundamentals → Sentiment → Behaviour → Time
Traditional analysis focuses heavily on the first three.
Financial-cycle research asks whether time and recurring natural rhythms can provide another layer of information.
—
2. The Solar Cycle
The Sun experiences an approximately 11-year cycle of solar activity.
One of the most familiar measurements of this activity is the number and behaviour of sunspots.
Solar activity varies considerably over the course of a solar cycle, moving broadly between periods of lower and higher activity.
Historical researchers have explored whether these changes have relationships with:
– Economic activity
– Agricultural conditions
– Human behaviour
– Social activity
– Commodity prices
– Financial markets
One of the early figures associated with this field was William Stanley Jevons, who investigated possible relationships between sunspot cycles and economic activity.
Later researchers explored similar ideas using different historical datasets.
The key concept for financial-cycle research is not that the Sun directly controls stock prices.
Instead:
«The solar cycle may provide a long-term temporal framework against which economic and behavioural cycles can be studied.»
—
3. Solar Activity and Human Behaviour
This is one of the most fascinating areas of the subject.
Human beings do not operate independently of their environment.
Sleep, biological rhythms, seasonal behaviour and exposure to environmental conditions can all influence human activity.
Historical research associated with Alexander Tchijevsky explored relationships between solar activity and periods of increased collective human activity.
For financial markets, the question becomes:
«If collective human behaviour changes, could investor behaviour change as well?»
A conceptual framework can therefore be written as:
Solar Activity
↓
Environmental Conditions
↓
Human Behaviour
↓
Collective Sentiment
↓
Risk Appetite
↓
Financial Markets
This is a research hypothesis, not a proven causal mechanism.
That distinction is essential.
—
4. Geomagnetic Activity
Solar activity is also associated with changes in Earth’s space environment.
One area of interest is geomagnetic activity.
Geomagnetic conditions can be measured using established scientific observations and indices.
Research discussed in Trading The Sun examines historical relationships between geomagnetic disturbances and market behaviour.
Some of the research cited in the paper reported relationships between periods of stronger geomagnetic activity and subsequent financial-market performance.
For a market researcher, this creates another question:
«Can geomagnetic conditions provide information that complements conventional market indicators?»
Rather than using geomagnetic activity as a standalone buy or sell signal, it can be placed alongside:
– Price
– Volume
– Volatility
– Market breadth
– Technical structure
– Economic data
– Sentiment
This creates a multi-factor research model.
—
5. The Moon — A Shorter Market Cycle
The Sun represents the longer cycle.
The Moon represents a much shorter rhythm.
The lunar cycle is approximately one month, with New Moon and Full Moon phases occurring roughly two weeks apart.
Researchers have investigated whether lunar phases correspond with differences in financial-market returns.
Some studies have reported historical differences around New Moon and Full Moon periods in particular datasets.
Why might this happen?
One proposed explanation involves environmental and behavioural effects associated with changes in nighttime illumination.
However, these explanations remain subjects for research rather than established financial laws.
For financial astrology, the Moon can therefore be treated as a shorter-term timing variable.
The conceptual hierarchy becomes:
☀️ Solar Cycle
Long-Term Environment
🌍 Geomagnetic Activity
Intermediate Environment
🌙 Lunar Cycle
Short-Term Rhythm
This creates a layered model of time.
—
6. From Solar Minimum to Solar Maximum
One of the observations discussed in Trading The Sun concerns the historical behaviour of stocks during different stages of the solar cycle.
The research examines periods between solar minimum and solar maximum and investigates relationships with stock-market performance.
The underlying behavioural concept is particularly interesting.
Markets can move through a psychological sequence:
Confidence
↓
Optimism
↓
Risk-Taking
↓
Speculation
↓
Excess
↓
Reversal
This sequence does not require astrology to exist.
It is a familiar feature of financial-market psychology.
The role of cycle research is to investigate whether natural cycles correspond with the timing or intensity of these behavioural phases.
—
7. The 2000 Market Peak
One of the most interesting historical examples is the period surrounding the March 2000 market peak.
The research discusses a notable timing relationship between:
– Rising solar activity
– The late-1990s stock-market advance
– The solar peak
– The market peak
– Changing geomagnetic conditions
– The subsequent economic downturn
A simplified representation is:
1997–2000
Rising solar activity
+
Strong stock-market advance
↓
2000
Major market peak
+
Solar peak
↓
After 2000
Changing solar and geomagnetic conditions
+
Market decline
↓
2001
Recession
This is an intriguing historical coincidence and deserves examination.
But it does not establish that solar activity caused the market peak or subsequent decline.
That is the difference between:
Correlation
and
Causation.
The value of the example is that it creates a hypothesis that can be tested against other historical periods.
—
8. Calendar Cycles and the Decennial Pattern
Markets also display many calendar-based observations.
One example is the decennial cycle, involving historical differences in market returns among years ending in different digits.
The research discusses the observation that years ending in 5 historically performed strongly while years ending in 0 performed poorly in the Dow Jones dataset examined.
But another question immediately appears:
«Is the calendar digit itself important?»
Or could the apparent calendar effect be related to a deeper cycle?
This leads to an important principle:
«A calendar pattern may sometimes be a reflection of a larger underlying cycle.»
Therefore, instead of simply memorising historical seasonal rules, researchers should investigate the larger context in which those years occurred.
—
9. Financial Astrology and Scientific Testing
Financial astrology remains controversial.
It does not have broad scientific acceptance as a predictive financial discipline.
That does not prevent researchers from asking testable questions.
The modern approach should be:
Step 1 — Observe
Identify an apparent historical relationship.
Step 2 — Form a Hypothesis
Define exactly what relationship is being proposed.
Step 3 — Collect Data
Gather sufficiently large historical datasets.
Step 4 — Test
Use statistical methods to determine whether the relationship is meaningful.
Step 5 — Validate
Test the same hypothesis across different markets and time periods.
Step 6 — Challenge
Actively look for periods where the hypothesis fails.
Step 7 — Replicate
Determine whether independent analysis produces similar results.
This leads to a powerful philosophy:
«Astrology can generate hypotheses. Data must test them.»
—
10. The Five-Layer Cosmic Trading Framework
A modern Cosmic Trading Strategy should not attempt to replace conventional financial analysis.
Instead, it should combine different information layers.
Layer 1 — Market Structure
Study:
– Trend
– Support and resistance
– Breakouts
– Moving averages
– Volume
– Volatility
– Price structure
Layer 2 — Fundamental Environment
Monitor:
– Inflation
– Interest rates
– Economic growth
– Corporate earnings
– Liquidity
– Monetary policy
– Fiscal conditions
Layer 3 — Investor Sentiment
Observe:
– Risk appetite
– Investor positioning
– Fear and greed
– Market breadth
– Volatility sentiment
– Speculative behaviour
Layer 4 — Natural Cycles
Study:
– Solar cycles
– Sunspots
– Geomagnetic activity
– Lunar phases
– Seasonal patterns
Layer 5 — Risk Management
This layer should remain fundamental.
No natural cycle can remove uncertainty.
Therefore:
Position sizing
Stop-loss discipline
Diversification
Capital preservation
remain essential.
—
11. The Future — Data-Driven Cosmic Market Research
The future of this field should not depend on repeating old observations.
It should depend on testing them with modern data.
Imagine a research database containing:
☀️ Solar activity
🌍 Geomagnetic indices
🌙 Lunar phases
📊 Stock-market prices
📈 Volatility
🧠 Investor sentiment
💰 Interest rates
📉 Inflation
🏦 Liquidity
🌐 Macroeconomic indicators
Researchers could then investigate whether natural cycles provide information beyond conventional indicators.
For example:
«Does a particular cycle correspond with statistically significant changes in returns?»
«Does the relationship survive different market regimes?»
«Does it work outside the original dataset?»
«Does it improve risk-adjusted performance?»
«Does it remain significant after accounting for conventional market factors?»
These are the questions that can move the discussion from belief toward measurable research.
—
12. A New Philosophy of Market Timing
The purpose of Cosmic Trading Strategies is not to promise certainty.
Markets will always contain uncertainty.
Instead, the framework encourages traders to examine several dimensions simultaneously.
PRICE
What is the market doing?
FUNDAMENTALS
What economic forces may be influencing it?
SENTIMENT
How are investors behaving?
CYCLES
Where are we within the larger time structure?
RISK
What happens if the analysis is wrong?
This produces a simple philosophy:
«The objective is not to predict everything.
The objective is to understand more.»
—
Conclusion — Reading the Market Through Time
Financial markets are complex human systems.
They are influenced by economics, technology, policy, liquidity, psychology and countless other factors.
Natural-cycle research adds another question:
«Could the environment in which human beings operate also have measurable relationships with collective financial behaviour?»
Trading The Sun provides an intriguing starting point for investigating that possibility.
Solar cycles offer a long-term framework.
Geomagnetic activity offers another measurable environmental variable.
Lunar phases provide a shorter recurring rhythm.
Market data provides the test.
Risk management provides the protection.
For SITHESH FINANCIAL ASTROLOGER, this becomes the philosophy of:
COSMIC TRADING STRATEGIES
Price tells us WHAT.
Fundamentals help explain WHY.
Sentiment shows HOW investors behave.
Cycles help us study WHEN conditions may change.
And above everything:
RESPECT THE RISK.
The Sun does not guarantee a market signal.
The Moon does not eliminate uncertainty.
Astrology does not replace financial analysis.
But studying natural cycles can encourage us to examine financial markets through another dimension:
TIME • RHYTHM • BEHAVIOUR
That is the beginning of the research.
That is Trading the Sun.
—
SITHESH FINANCIAL ASTROLOGER
COSMIC TRADING STRATEGIES
Study the Cycle.
Understand the Time.
Study the Behaviour.
Respect the Risk.
—
IMPORTANT DISCLAIMER
This article is an educational adaptation of concepts discussed in John Hampson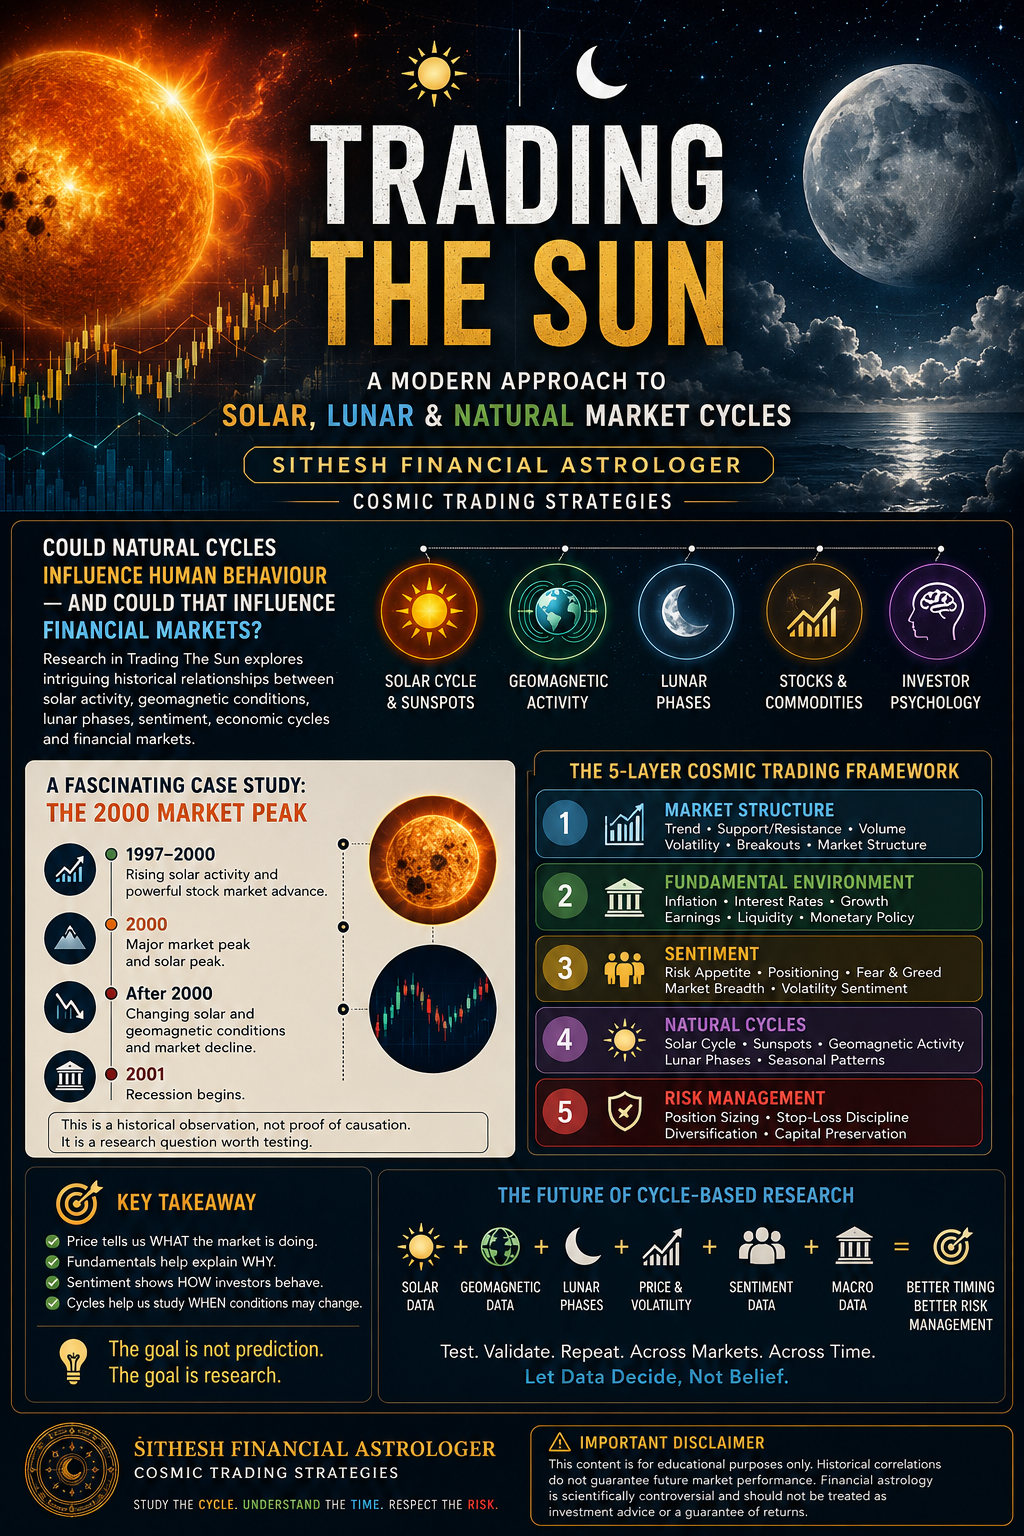 ‘s Trading The Sun (2012).
The relationships discussed are historical research observations and should not be interpreted as established causal laws of financial markets. Financial astrology remains scientifically controversial.
Historical correlations do not guarantee future market performance. Solar, lunar or geomagnetic cycles should not be treated as standalone trading signals or guarantees of returns.
This article is intended for educational and research purposes only and does not constitute investment advice, financial advice, or a recommendation to buy or sell any financial instrument.